The UK's Energy Pathway to 2050: Questioning the Evidence
The critique looks at the data used as evidence by the Department of Energy and Climate Change in its pathways to 2050. It is based on a Pugwash report from 2013, and particularly looks at trade-offs and uncertainty in the creation of an interactive tool designed by the DECC tool in building three possible energy scenarios. Available at: http://2050-calculator-tool-decc.gov.uk
4th November 2017
Introduction
British Pugwash is a network of experienced professionals in international affairs and cross-sectorial scientists. They built on data quantitative and qualitative to report how the UK can reach its target of 80% less greenhouse gas emissions by 2050 (compared to 1990 baseline levels). To do this, leaders from within the larger British Pugwash team collaborated to outline 3 highly probable but different scenarios that identify key variables such as technological capacity, market trends and the UK’s current energy capacities in scenarios of “high nuclear” energy, “high renewable energy” or “intermediate” between nuclear and renewable energy.
In 2013, the Department of Energy and Climate Change (DECC) built on scientific and engineering data with other organisations, to develop an open source model called the “Pathways to 2050 Calculator”. With a timescale up until 2050, the interactive model is objectives led and based on reducing GHG emissions while considering UK pathway costs, capacity constraints and technology mixes. It attempts to diminish some uncertainty around the UK’s climate change strategy through considering variables such as 43 energy-related issues, quantifying trade-offs and depicting impacts in multiple scenarios across the UK’s energy and economic landscape (on GHG emissions).
Target Audience
Both the report and model are intended to cater to varying opinions on how emissions may be reduced through engaging the public in a critical and time-sensitive debate on the future of emissions. The model also differentiates between “users” and “more advanced users” and enables both to set parameters for pathways that shows “levels” and “trajectories” (British Pugwash 2013, p.15). It is primarily intended for informing decision-makers in the government (e.g. policy departments), private sector (e.g. private energy companies, technicians, commercial organisations) and the general public’s opinion on the dire need for action to combat climate change. Yet since its development, the model is also being used by other organisations and countries as a means for replication.
Data and Processing Methods
The types of data used in the report and particularly in the DECC model emphasises quantitative data in varying forms, with particular emphasis on the long term dynamics of different scenarios. The model plugs variables into an integrated sociotechnical and economic framework and depicts data in the form of percentages, numerics across 73 spreadsheets (in its excel version), and 43 headings that depict either sources or modifications in energy issues. The model uses algorithms to compute user choice combinations of these headings.
The report also includes but is not limited to depicting energy pathways through using numerical measures of power and energy, tables for existing demand and supply conditions, physical and economic cost estimations for energy mixes and statistical averages. It also uses data from models like the Poyry Max’s capacity figures for renewable calculations. Some examples of quantitative processes applied to the data include the “generation of cost estimates” based on Mott MacDonald data (partly qualitative), that incorporates different ranges of current and future estimated or “levelised cost” (p.66). Since the model relies on calculating costs for emissions and that the capacities to ensure demand and supply will work within existing (and future) constraints, estimations actually build on previous quantitative datasets (e.g. Digest of United Kingdom Energy Statistics 2011).
Though the DECC is a quantitative model in essence, there are qualitative overlaps. This includes the assumptions underlying the UK’s commitment to 80% less emissions (e.g. knowledge around climate change and emissions is incomplete). Qualitative data also takes the form of historic data that has informed policy decisions in the UK and other countries (which uses quantitative observations as well), visuals like the energy flow chart and map of power stations in the DECC model, and descriptive interpretations of pathways in the model. It appears in the choice of issues that pertain to the energy landscape and norms around interpreting data points like the following statement: “it is commonly agreed that… wastes are less demand than spent fuel” (p.33).
A key example of qualitative data is in choosing discount rates for future technology calculations, where the DECC and British Pugwash differ in their view on market acceptance for technology. Moreover, another example like the assumption that future generation deserve the same “degree of protection as the present one” emphasises the role of values and judgements in methodologies but is also indicatory of uncertainty about the reliability of choices (p.44).
By building on a range of evidence across multidisciplinary areas, the model is integrative in its consideration of future scenarios while trying to mitigate uncertainty around technology and pathways. The report also integrates mixed methods of analysis, which encompass a plurality of views about preferred energy mixes and a variety of expert judgments in the field. The use of mixed data is unsurprising given the contextual embeddedness of energy choices in interdisciplinary fields (economic, sociotechnical and environmental) and that the model is essentially a representation of different scenarios for stakeholders facing choices in energy usage.
An important example of both qualitative and quantitative data is the Sankey diagram used in the DECC model. The diagram uses graphical representations of energy conversion in qualitative form but builds on numerical values for energy losses and flows. Furthermore, the model builds heavily on earlier reports, policy documents (e.g. Energy White Paper of 2003, Stern Report of 2006) and scientific literature (e.g. study of renewable resources by ARUP).
Rigour and Accuracy
The authors of the Pathway report and the DECC calculator have taken a number of measures to enhance the rigour of their studies. Apart from inputs from various experts, both build on a wide range of evidence across multiple disciplines.
The reliability of qualitative data in the model is also enhanced by using different methodologies to support scenario development. For example, the report uses the UK DECC survey to support pathway findings strengthens assumptions about public opinion (e.g. regarding nuclear energy). However, in the DECC calculator, the selection of terms appears to be arbitrary and may not accurately reflect the category intended. For example, there is no explanation for why only 21 of the 43 headings are labelled “primary energy” (p.45).
The fact that the DECC calculator has gone through an iteration cycle in 2012 is indicative of rigorous development (in response to feedback mechanisms). An important example of rigour to enhance the reliability of the DECC calculator is its stress test to consider unanticipated conditions within the model, in which the pathways also pass the stress test.
Yet, questions around the transparency and format of the algorithms used and the numbers in different excel tabs of the DECC model create potential inaccuracy and uncertainty around whether consistent numbers occur through the model. Another example is through ensuring that calculations occur across all sectors and that there is the possibility of supply exceeded demand in all three pathways.
When considering statistical reliability, all energy figures are largely derived from the Digest of United Kingdom Energy Statistics, which is based on 2010 figures. This raises some concerns over how accurate these figures are today. Furthermore, the term “significance” appears throughout the paper and implicitly through the model but there is no indication of the kind of intervals used to gauge the significance of different variables. There are also some varying data ranges (e.g. energy flow losses along the flow if renewables supply from source to user) that make it difficult to consider accurate levels of numerical.
However, since the consideration is of multiple long term future scenarios, in-built assumptions such as those that go into the calculation. In the DECC model, calculations like discount rates, carbon taxes (making fossil fuel more expensive) and perceived risk assessments through cost-benefit analysis (e.g. for nuclear generators) are arbitrary and may skew to be too high or too low. This creates uncertainty in the results and may not represent future scenarios accurately over the long-run. For technology, the DECC calculator follows a 3.5% discount rate and does not incorporate carbon penalties into its modelling.
Finally, the rigour of the model faces challenges in accuracy with respect to energy units. Since different industries use different measures, inter-conversion into a standard unit poses questions about accurate measurements and about the presence of time when calculating ratios between maximum possible power and average annual power for energy sources when incorporating variables like maintenance into modelling.
Uncertainty
The most obvious form of scenario uncertainty is represented by the different pathways in the report and the manipulation of variables for outcomes in the DECC calculator. More specifically, alternative scenarios also occur in other reports such as the Oil Crunch Report (2008) which developed a scenario of future energy (e.g. 50% electricity. In each of the three pathways considered, chosen levels (e.g. 2 over 3) represent alternative demand choices that would achieve other targets.
Building on this but closer to a form of scenario uncertainty than recognised ignorance is that the report considers alternative scenarios, including the decommissioning of more nuclear plants than estimated, ineffective disposal systems, release of CO2 rather than capturing through carbon storage systems. Yet, without explanations of outcomes, such events indicate uncertainty more than anything else.
Regarding uncertainty, a number of assumptions about future markets occur through the pathways studies. One particular assumption regarding excess electrical energy is that both the Pathway to High Renewables (based on headings from the DECC model) assumes that surplus energy may be exported. This inherently assumes that a market for such will exist and capture the value commanded by investments in returns. Other assumptions take the form of time alignment between reactor decommissions and new technology developments.
Furthermore, both the report and the calculator accept 80% reduction targets as a premise for partially mitigating climate change, while an alternative scenario may be to consider cumulative emission not annual figures to achieve this. Uncertainty is enhanced by the fact that a fundamental underlying assumption of both the model and report is that carbon emissions are a key to combating climate change. Yet a number of unknown variables still exist around emissions and climate change, such as the rate of heat absorption by oceans. There is also no mention of why other possible pathways weren’t considered in the report or why 1990 was chosen as a base year.
Recognised Ignorance
Apart from the obvious uncertainties in technical, economic and political areas, the report highlights areas where ignorance about existing conditions is recognised and spills over to diminish the reliability of the DECC as well since it is based on the DECC spreadsheet. The authors recognise the role of “personal opinions” in assessments and limited knowledge about supply mixes for energy pathways.
They also recognise that renewables are still young and studies on their costs may not be accurate (particularly when energy pathways cross sectors) and economic costing of many variables may ignorance certain factors (like excess heat from nuclear plants). Both also fail to account for GHG emissions from mining uranium for nuclear energy, and do not incorporate the statistically risks of nuclear disasters on energy pathways. They also recognise the fact that CSS is a new technology with inconclusive evidence on its risks and questions about feasibility of investing highly in technologies like renewables.
While the pathways and calculations are partly based on technologies that are already commercially mature, they choose discount rates somewhat arbitrarily. They also recognise the difficulty in credibly predicting whether the scale and target dates for such technologies will meet future energy designs.
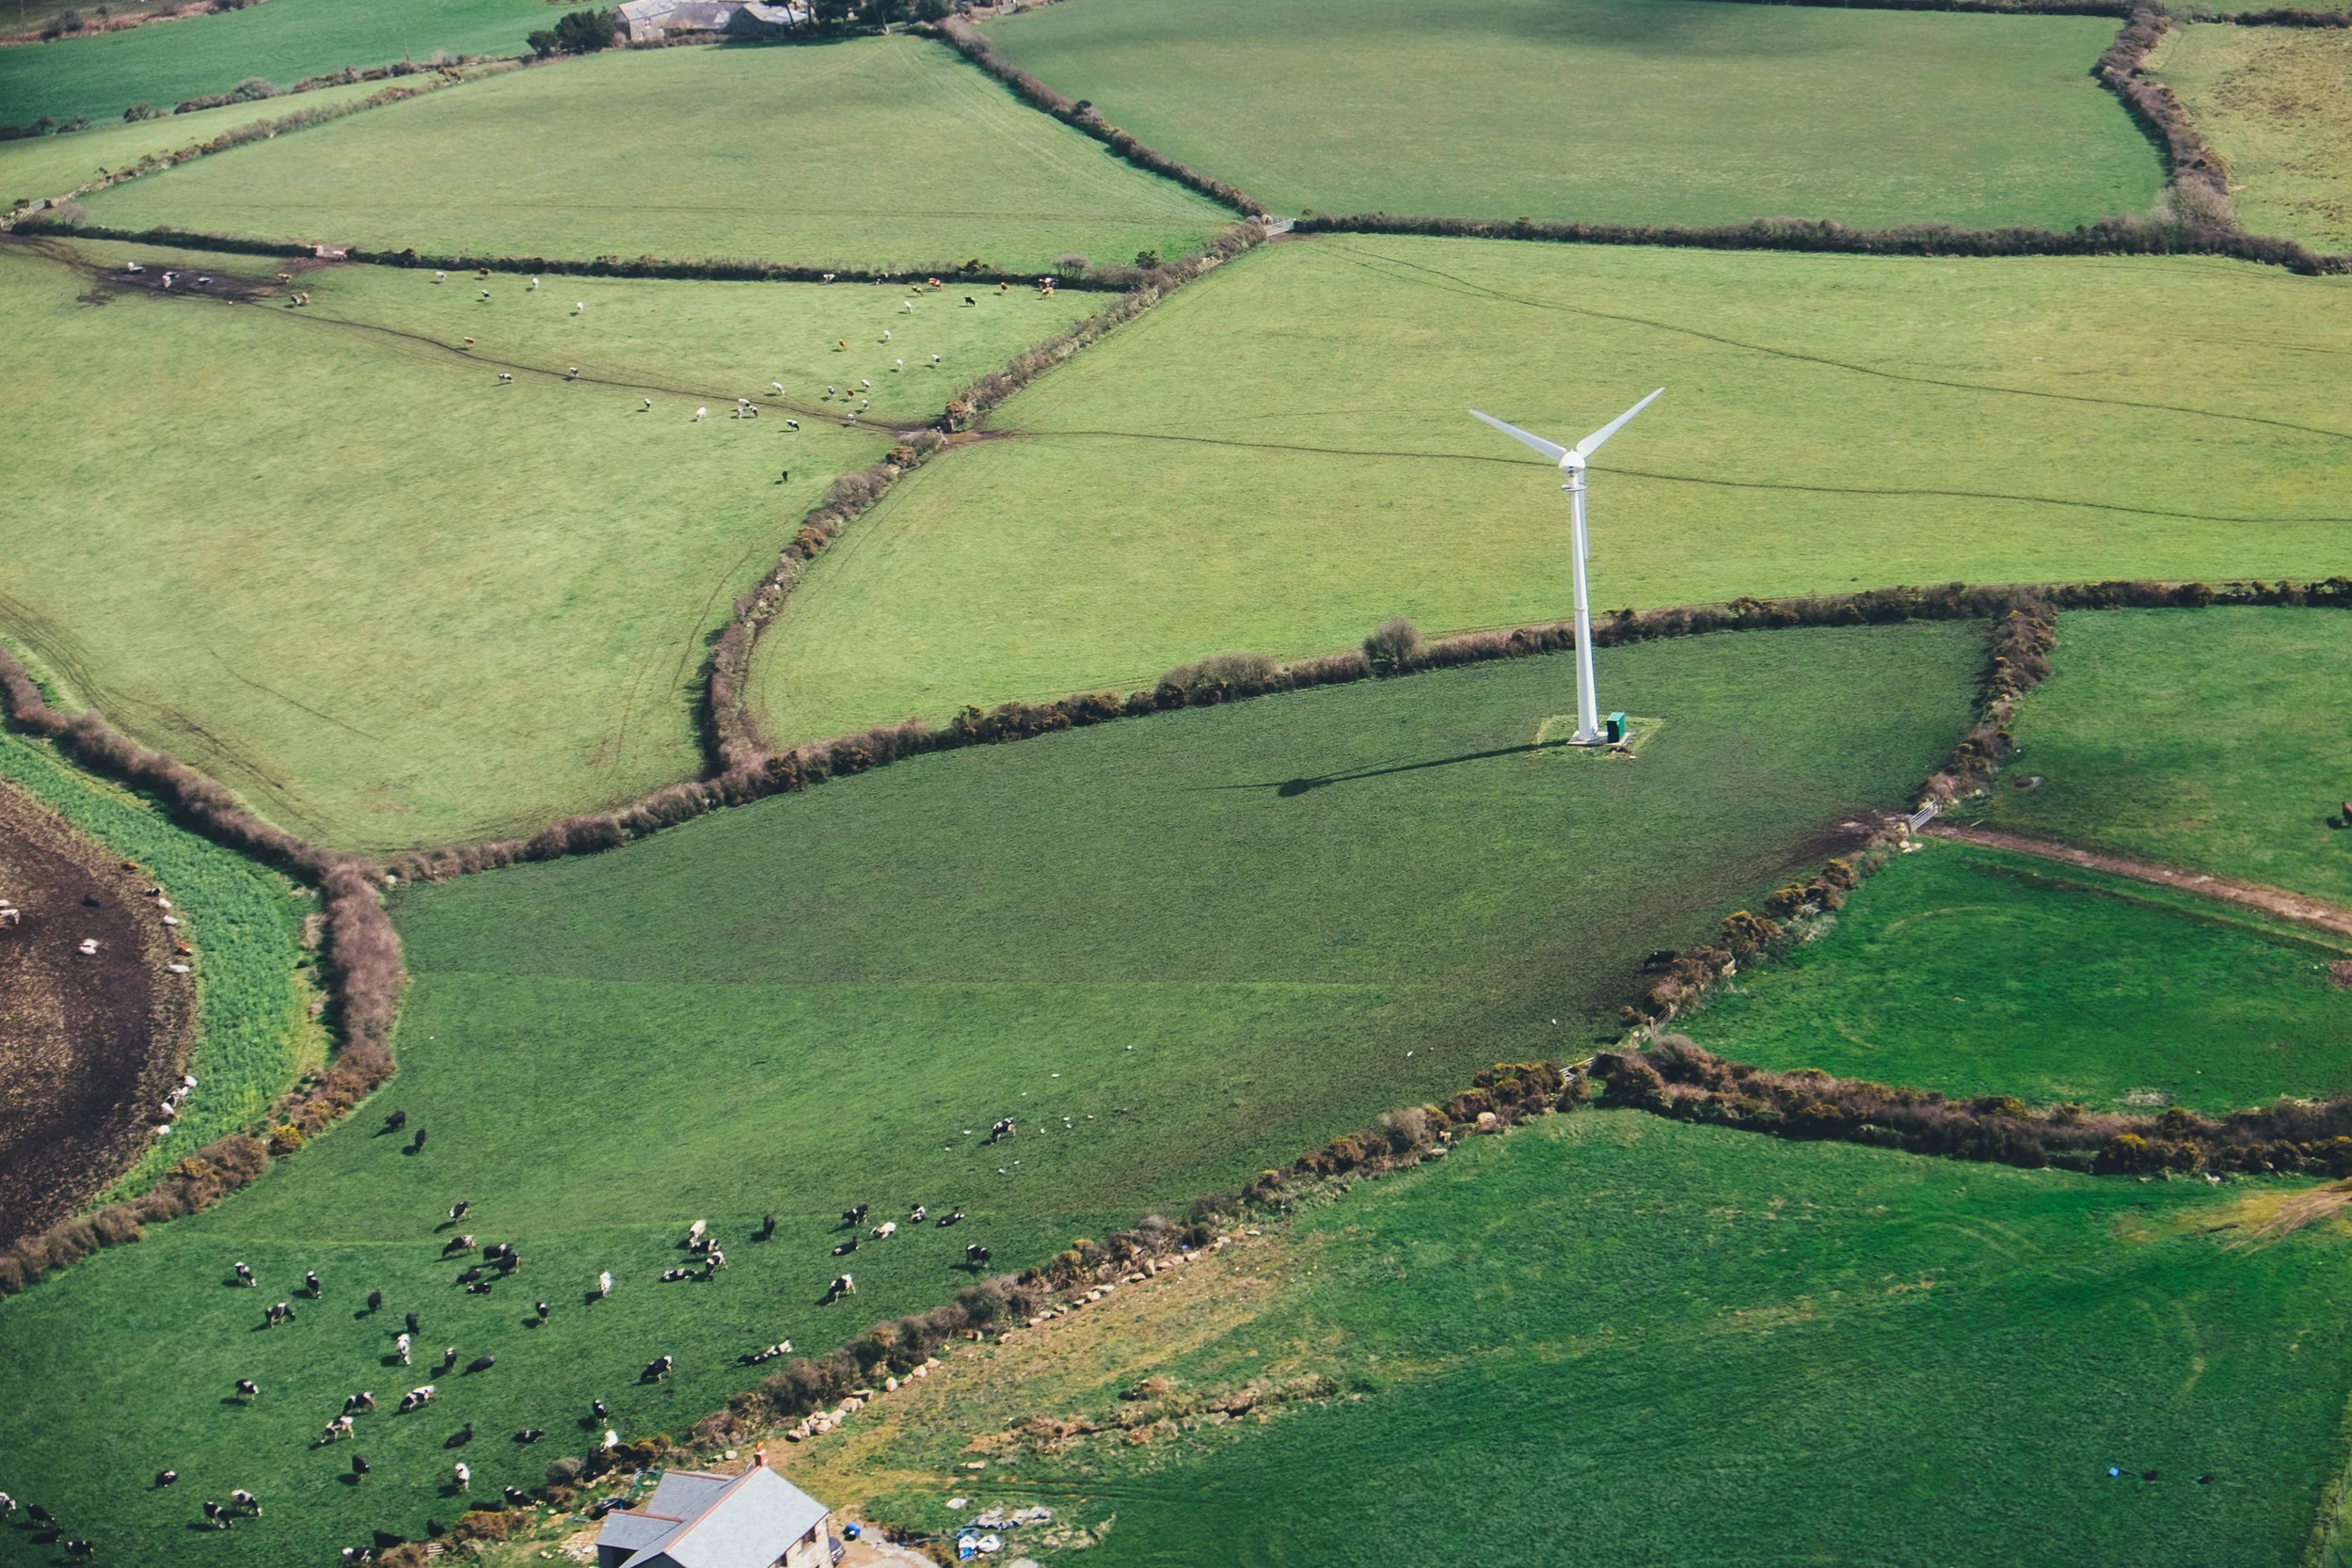
While the DECC calculator is more ambitious in its pathway credibility (aimed at 2030), the report acknowledges that unknowns and delays exist around emerging technology which may when they will emerge. It also recognises the difficulty of predicting behaviours (e.g. responses to land use for energy over agriculture). Finally, the report recognises the risks associated with any strategy and that certain conditions like behavioural change or climate events may cause highly variable demand that are unanticipated and not considered in the models.
Reflection
Constraints in both models come from the unclear economics and assumptions relating to the modelling of costs, technology and some renewables that are vulnerable to high intermittency (e.g. sunlight or wind based inputs). While assumptions about uncertainty are necessary, the model could benefit from building on risk (e.g. failure of specific technologies or plants).
Furthermore, although the problem for scenario-based modelling is clear, uncertainty exists around the technologies and risks within the sociotechnical system (particularly with respect to disposing of nuclear waste, carbon storage, renewable technologies and coordinated standards for international designs). Since the timescale of each model is long, there is no way to incorporate tangible monitoring or evaluation into a uniform feedback system. Added to this limitation for users are inflexibilities around adding new variables into calculations. Given the futuristic nature of pathways, experimentation is at best possible through comparisons with other systems.
Although certain factors influencing pathways (such as welfare) are not quantifiable, the DECC calculator is comprehensive in outlining a variety of energy issues and incorporating the dynamic nature of time in an understandable way. As a model, it does well to work within the constraints of its system and uses integrated analysis to characterise plausible scenarios as best as possible. Proof of its ability to generalise scenarios lies in the fact that the Pathways to 2050 Calculator is being adopted as a tool by other international organisations.