A Future Energy Model for Malta
This report will be published as a part of a larger work by the Sustainable Energy Futures Department, The Bartlett School at University College London. It builds upon quantitative information, underlying the land-energy nexus in Malta. By highlighting some of the key characteristics that explain Malta and thus, Gozo’s, current energy system. It addresses the question of how Malta can reduce its import dependency on fossil fuels. Using data over 10 years, the findings concentrate on energy security, meeting EU targets for 10% renewable energy and population demands in Gozo. The resulting model is built upon the premise of Malta’s renewable energy systems, while identifying key areas like policy framework and climate, through which PV technology may contribute to higher efficiency within the nexus.
May 2018
Introduction
Located about 90 kilometres to the south of Sicily, Malta is stretched across 5 islands in the Mediterranean Sea and is relatively isolated. Amongst these, the main island of Malta, Gozo and Comino are inhabited islands. As one of the world’s smallest but most densely populated countries, the economy and population of Malta has grown rapidly over 20 years, hence placing heavy demand burdens on an inefficiency energy system. Despite strong potential for renewable energy systems (RES) and requirements to follow the EU’s decarbonisation policies, Malta is faced with a strong fossil fuel lock-in that is exacerbated by policies that are in-conducive to land utilisation for RES.
Limited statistical data on Gozo’s current water and energy networks mean a substantial amount of this analysis has been based on figures extracted from data about Malta overall. In some regards, this has required further assumptions to inform analysis in the following section, however since the island is small and all of Gozo’s energy is dependent on the main island, the analysis can still be considered significantly rigorous from the perspective of energy production and consumption.
2. Context
Apart from its small size and insularity, Malta’s distance from mainland Europe suggests that is must depend largely on air and sea for transport. Viewed with its small size and thus limited market, economies of scale are difficult to achieve and transport costs remain high. There are also implications from Malta’s weather conditions. Climate change and vulnerabilities to fluctuations despite averages (see figure 3), indicate the need for flexibility in energy systems as both demand and supply may be driven by changing conditions but are also determined by a range of challenging inflexibilities as will be illustrated in the context below.

Climate
Surrounded by deep sea, investments in offshore wind are limited due to inadequate technology such as substructures despite topography that is conducive to wind power (e.g. low hills). In general Malta has limited rainfall (see figure 2). In view of this, no permanent lakes or rivers and just 1 freshwater course through Gozo, indicate a high stress on water resources. With its small size and vulnerability to sea-level changes, increases in sea level or temperature are likely to exacerbate water shortages (Haslam, 1989). This explains the island’s dependency on desalination (3% of electricity generated) for 50% of the island’s potable supply, and rules out hydropower-based generation (Odyssee-Mure, 2015).
With no potential for tidal energy, wave energy has limited potential for large-scale demands (Energiewende Team, 2017). However, with respect to sunlight, Malta’s climate is characterised by approximately 3000 hours of sunlight per year, from a minimum in December to a maximum of 376.7 in July (see figure 1). This has promising implications for solar power, whereas on the other hand, Malta’s hot summers and mild winters (see figure 2b) suggest a high demand for cooling appliances from the hottest months with the lowest rainfall, May to August (see figure 2a).
Population & Economy
Eurostat (2017) classifies Malta as containing two urban zones, namely Valetta in the main island and Gozo. This is because Comino is 3.5 m2 and is virtually uninhabited with just 3 residents, leaving Malta and Gozo as the only populated islands. As depicted below, Gozo lies north of the main island and covers land measuring 67 m2 compared to 256 m2 in Malta.


Figure 3. Map of Malta and Gozo (Source: Google Earth)
Malta has an estimated population of 445,000 people across its 246 m2 landmass, amounting to a population density of about 1.346 persons per square kilometre compared to about 130 in Denmark (Eurostat, 2018). Of this number, Gozo accounts for about 8.4% or 37,342 people but with an average household size of about 3 persons, which is similar to that of Malta. Furthermore, as an attractive tourist destination, the economy is heavily reliant on tourism with about 1.7 million visits in 2014. Combined with a high population density, this makes land area scarce and demand for resource facilities like energy supplies and electricity competitive.
While both Malta and Gozo are susceptible to volatile shifts in their populations as emigration amongst young people remains high, figures report a steady increase in Gozo’s permanent residents with 30,000 permanent residents but a decline in Malta’s (Odyssee-Mure, 2015). Additionally, with a slightly lower birth rate in Gozo as opposed to Malta, this study assumes that both islands will experience a similar growth rate of 0.6% from 2016 to 2020, if other factors like natural events remain constant (NEEAP, 2014). Thus based on these indicators and historical data on population growth, figure 4 suggests a relatively linear trend for household growth in Gozo.

As a trans-shipment point, the service-based economy benefits from its strategic location as a trans-shipment point between Europe, North Africa and the Middle East. Apart from tourism and foreign trade, the main sector contributing to Malta’s 6.3% growth rate and 29,200 euro GDP per capita (Odyssee-Mure, 2015), is industry. This includes manufacturing through textiles and exports of value-added goods, specifically electronics. The latter industries account for its high employment rate, but also have implications on the electricity demand, transport network and add to the use of land. Imports in Malta are dominated by oil as suggested by figure 6a, and predominantly exceed the amount of total exports that appear to be driven by oil. Of Malta’s main trade partners is the European Union, accounting for 53.2% of total imports in 2017 (NSO, 2017).

As highlighted above, services, particularly foreign trade and tourism, is the largest contributor to Gozo’s economy. This suggests not just a growing trade deficit driven by import dependencies- reported at €298.1 million in September 2017- but high dependency on a limited range of exports as well (NSO, 2017). In light of this and considering Malta has no local fossil fuel sources of its own, the island will benefit from decreased import-dependency on fuel. It could do this through developing its own renewable energy sources for security and ensuring it meets EU targets for decarbonisation. This would also prevent disruptions in trade with EU countries
.

Figure 6a. Import Value (Source: OEC Maps)

Figure 6b. Export Value (Source: OEC Maps)
3. Current Energy System
Energy consumption on the island can be divided by sector, with the main sectors being domestic, industry (manufacturing and textile included) and commercial (foreign trade, agriculture and tourism included). Within this nexus, both electricity and heat are consumed in the generation of energy and water, in processes like cooling and transport both on the island and externally. The complexity of these interlinks in the system lead to the necessary assumption that one part of the nexus cannot be separated from the other.
Viewed in the context of Malta’s economy, data over the last 5 years indicate that the main energy consuming sectors in Gozo are transport and power for industry, where no efficiency gains are being reported (Odyssee-Mure, 2015). Alongside high population density and even though limited in size, car ownership per capita is estimated to be the fifth highest in the world with an estimated 607 vehicles per 1000 people. Additionally, a 2% increase in final energy consumption of the transport sector from 2012 to 2013 was driven by an increase in aviation, leading from tourism of 138,739 in the same year (Odyssee-Mure, 2015).

In terms of fuel consumption, power stations use 74% of the fuel while road transportation is at 19% (see figure 7). Though much lower than domestic energy consumption, fuel consumption is driven by cooking and space heating, explained by a shift towards LPG heaters from electric space heaters (Odyssee-Mure, 2015). Overall, a fall in consumer demand for electricity was visible through higher tariffs and awareness of efficient energy, however assuming population growth and stabilised pricing for energy efficient technologies (following Moore’s Law), shifts in behaviour are unlikely to be enough even if technology is more effective for energy saving.
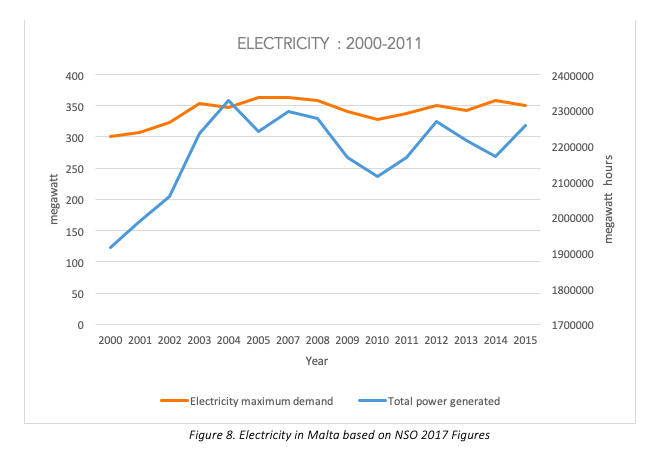
Although Gozo is characterised by hot summers that would explain higher energy consumption in summer months, a trend towards cooler winters leads to the assumption that there may be a trend towards higher fuel consumption for heating. This is supported by the fact that July 2015 registered Malta’s highest peak demand of 438 MW assumedly due to cooling demand, whereas January 2017 saw a seasonal high of 410 MW (NSO, 2017).
Consistent information on the last few years is difficult to gather, considering Malta has undergone significant changes in its electricity supply landscape and will take time to collect predictable results on its networks. However, since no major population shifts or other events like oil-price shocks have occurred since 2008, figures from 2011-15 are used for this model.

Malta’s current energy system remains isolated with no local fossil fuels, very limited renewable energy and heavy dependence on the import of refined oil. In 2016, 68% of Malta’s electricity is reported to have come from the interconnector, with an additional 9 Liquidified Natural Gas (LNG) shipments between November 2016 to December 2017[1] (Morgan, 2018). Additionally, all electricity is either supplied through a bi-directional interconnector with Sicily that was commissioned in 2015, or generated via the Delmara Power Plant (Enemalta, 2016). Table 1 illustrates the existing landscape of Malta’s energy suppliers and thus illustrates Gozo’s existing energy system.
As mentioned below, Enemalta is the island’s only licensed network of energy supply and all larger projects are run by majority state-owned Enemalta (see figure 7 for context). Enemalta is also responsible for the import, storage and wholesale of 89% of Gozo’s fuels based on 2013 figures (NSO, 2015). though some small localised networks exist for renewables, they either have to supply to Enemalta or can run small-scale local projects.

Figure 10. Timeline of Energy for Malta (source: NSO 2015)
Discussion
Considering Gozo has no independent energy supply and is connected via several 33kV sea cables via 2 distribution centres at Qala and Xewkija (routed through Cominio), it is assumed that the island is entirely dependent on the main island’s interconnector and power supply (See figure 11). While the Xewkija Centre is more centrally located and ensures higher reliability of supply alongside additional underground cables between localities, the challenges of energy security and efficiency are the same as the main island. These are exacerbated by substantial transmission losses, low energy diversification and carbon emissions (which decreased by 34.8% after the interconnector became operational and another undisclosed amount after Marsa B’s power plant closed down in 2017.

Figure 11. Transmission System updated in 2014 (NSO, 2015)
Viewed in parallel to recent developments like upgrades to the distribution network (5 new centres and 100 kilometres in underground cables (to replace overheads for efficiency), the figure below suggests that Malta’s policies have been relatively successful over the last 10 years. Geared towards targeting consumers through incentivized purchasing plans of renewable systems and communication strategies, energy awareness appears to be working. This is evidenced in the adoption of renewables amongst commercial and residential consumers has already increased to 20% and wasted energy appears to have been minimised, assumedly due to high costs.
On the other hand, the cost of energy has still been increasing and an absence of coordination between Enemalta and small operators implies a loss in energy efficiency (NEEAP, 2014). Although demand-driven costs have risen, the shutting down of Marsa B power station has led to a 155kW reduction in supply until the ElectroGas plant at Delimara is operational and is estimated to reduce emissions by 50% in line with EU policies below. This also indicates a shift from internal combustion towards LPG.
Policies
Figure 12. Energy Policies: 2008- 2018 (Source: NSO, 2015)
Some of the aforementioned measures are just re-bundled from previous ones (e.g. soft loans) and would benefit from more active policy interventions such as the new domestic PV scheme of July 2015, which involves behavioural shifts. By offering a 50% grant on solar home systems (capped at 2300 euros) and a feed in tariff for 6 years, consumers are likely to be more proactive, however if they financial support is withdrawn, behavioural shifts may not be as long term. Additionally, gaps in energy efficiency based on sectors like transport (accounts for 19% of fuel) are not being addressed by policymakers.
Finally, with the second lowest deployment of Renewable Energy Systems (RES) within the EU, it appears that Malta is far from the EU’s 2020 target (Eurostat, 2017). On the other hand, compared to France and the Netherlands, from 2005 to 2015 Malta has increased its deployment of RES’ from 0 to 5% and is half way from its 2020 target of 10%. Additionally, with relatively low carbon emissions per capita compared to the rest of Europe, Malta and hence Gozo, is faced with the challenge of decarbonisation but also the promising opportunity for energy security. Therefore, although Malta has visions for developing more interconnectors between Malta and other European and North African countries to become a hub, the future is limited by a number a challenges.
4. Future Scenarios
The following analysis is based on the assumption that the base year of 2010 based on the introduction of Malta’s National Renewable Energy Action Plan and the introduction of changes in the energy landscape. Malta’s current energy-land nexus has shifted from one of complete monopoly power driven by Enemalta to the introduction of the EU Directive, which has imposed restrictions on carbonisation and renewable energy. The model supported by the existence of policies such as feed in tariffs over 20 years for each kW from PV installation which assumes a correlation between financial incentives and PV capacity (see appendix 5).
Assumptions
The following assumptions explain the challenges and rationality underlying what Malta’s an energy nexus can look like by 2050.
Discussion
Based on Table 2 and existing limitations, Gozo’s optimal scenario would be based on RES targets being met and then exceeded after 2020. If we assume that the maximum share of RES is both cost efficient and effective at reducing losses based on technology, a high electrification scenario starting from 2015 can phase out dependence on oil without reducing consumption as shown below in the domestic sector. An innovative scenario can meet constraints about space through dual spatial. Spatial analysis using Google Earth by Farrugia et al. (2010) suggests that 78% of dwellings have space for solar water heaters in houses, with 12.5% of Gozans already having them installed in 2010.


Figure 14. Land use in Gozo (Source: NSO, 2015)
Since energy on other sectors are representative of Malta as a whole, that in order to reduce import dependency and increase export potential, an optimal scenario would require rapid growth in renewable energies apart from solar (see figure 14). Even if solar is increased by a value of 10%, it will incur limitations with respect to limited land use. Furthermore, given the constraints outlined in Table 2, the island has limited potential for alternative RES systems. Hence, a scenario of 100% RES through developing RES in other countries and importing it through an interconnector may be a viable option given Gozo’s strategic location. Given the promise of the new Sicily-Malta Interconnector’s bi-directional capacities, such a solution shows promise.
This may be supported by the deployment of electric vehicles in order to significantly reduce fuel consumption from transport as depicted in the model below. The model illustrates reduce reliance on fuel through an electrification scenario, hence altering the need for imported fuel considerably while accounting for population growth (19% in 2015).

5. Conclusion
Malta will remain constrained in terms of land use, geographical position and its existing fuel lock-ins. The unpredictability of climate and temperature fluctuations add to the need for more storage capacities that can ensure energy security. In order to increase RES, a number of trade-offs are likely, particularly concerning the area of policy.
Data constrains have meant the need to assume that some figures remain consistent over several years and have not allowed an in depth analysis of certain sectoral compositions like industrial use. This has lead to more of a focus on the electricity and heating sector but is likely to be representative of the transport sector as well since the integration of the power sector seems imminent (e.g. Electrogas). Several other constraints are:
The model does not include a water nexus as the information on energy consumption from water is not available, though Malta is faced with no freshwater sources (see appendix 7, 8, 9).
Limited data due to the very recent change in existing nexus (2015), from the introduction of the interconnector, closing of Marsa B and increase of natural gas.
Datasets availability for Gozo is very restricted. This has led to having to model Gozo’s industry and transport based on Malta’s overall system.
Unpredictability in the analysis of technology and innovations.
Limited scope of energy policies beyond present framework (e.g. feed in tariffs of solar PHVs are only applicable for 5 years).
Limited space restricted further study into the impact of electrification on transport.
Appendix 1

https://www.dropbox.com/s/omtrbd7vj4l3obd/Screenshot%202019-04-06%2004.55.25.png?dl=0
Appendix 2

Appendix 3

Appendix 4

Appendix 5

Appendix 6

Appendix 7

Source: Breur and Pilla (2015).
Appendix 8

Source:https://vassallohistory.files.wordpress.com/2014/03/interconnector0.jpg?w=645&h=454
Appendix 9
