1. DATA ANALYSIS OF AIR QUALITY AND CITIZEN HEALTH
London is no stranger to air quality concerns, particularly considering that the EU’s legal limits have resulted in a number of fines (BBC, 2018). The city’s recent lead on “Air Quality and Citizen health” as a member of the Attractive City Network presents an opportunity to showcase London’s ability to manage urban health related issues, but also requires rigorous data collection to inform policy outputs. The Attractive Citizens Network’s (ATN), focus on air quality as an indicator of citizen health relies on the World Health Organization’s (WHO) investigation of poor air quality’s role in driving illnesses include those that make life uncomfortable such as asthma, and respiratory and cardiac diseases that ultimately lead to premature deaths (WHO, 2016). Amongst the cities in the ACN are 106 other cities, including capitals like Berlin, Madrid, Lisbon and Paris, as well as less populated cities like Brugge and Bologna.
Context
Investigations by the WHO (2016) and European Commission (2014) have concluded that indicators of poor air quality take various forms and are based largely on inhalable particles from both human and natural activities. Common natural sources of pollution come in the form of dust and forest fires, while human activities contribute to poor air quality through combustion from fuels due to transport, industrial activities and heating (Bai et al., 2012; Bessagnet et al. 2005). Amongst these pollutants are sulphur dioxide, nitrogen oxides, volatile organic compound and particulate matter (PM) like PM10 that is composed of chemical particles of less than 10 microns in diameter (Brunelli et al., 2007).
Based on London’s role in the ACN, the following analysis will consider the relationship between air quality and citizens’ health in London through comparing it with 19 other cities. It will do this by investigating the relationship between air quality as represented by PM10 and outdoor exercise as an indicator of health. Since PM10 also compromises of secondary particles such as sulphur dioxides, has been linked closely to adverse health effects including mortality (Mellado et al., 2006) and is a closely monitored emission output by the WHO (2016). Furthermore, high concentrations have already driven policy efforts such as “Sundays on foot” in several European cities (Brunelli et al., 2007). Hence, it is reasonable to consider high PM10 concentrations as an indicator of poor air quality in the following analysis.
The diagram below depicts a hypothetical investigation of the relationship between air pollution, population and health. Based on the context above and the analysis below, the diagram illustrates how higher levels of air pollution lead to lower population through mortality rates but also higher population levels may contribute to poor air quality through emissions. Similarly, poor air quality may lead to lower exercise levels through unwillingness to be outdoors but policy interventions encouraging walking (e.g. Sundays on foot) may lead to lower PH10.

Quantitative Analysis
The analysis aims to illustrate an analysis of sample cities that would likely fall within the ACN by using the City Prosperity Initiative (CPI) of over 60 cities to establish some consistency in how ‘urban’ is defined (CPI, 2015). Thus, variables like productivity, infrastructure, quality of life (e.g. expectancy) and equity are somewhat controlled for and summed to calculate a CPI point on a scale of 1-100. In order to create a rigorous and representative sample, a minimum of 3 cities are selected across CPI’s 6 city categories (ranging from very solid to very weak). Furthermore, the sample aims to have a wide variation in geography to ensure cities from across continents are represented for a robust comparison to London, however with a higher concentration of European cities to reflect a degree of cultural similarities and infrastructural similarities with London (e.g. more public transport). Each city is above a minimum of 200,000 people to reflect its ‘urban nature’ and reflect data from sources ranging over a 10-year period in an attempt to reduce some discrepancy in variables (see appendix 1). The following figures and tables have been constructed using Microsoft Excel.

Before running a regression analysis, it is useful to understand where London is placed within the context of emissions as compared to other cities as split by population. Figure 1 suggests that London’s PM10 emissions were at an average of 22 (see Table 1), which is just below the mean of 22.5.

As depicted in figure 2, a comparison London’s population levels relative to population compared to those in other cities is within an average range. When compared to maximum of 71 in Milan which is less populated and 7 in Sydney, the data is vulnerable to discrepancies about where the emissions are being recorded, what the season is as suggested by a high standard deviation of 17.6 from the mean. For a more accurate depiction, figure 3 shows a comparison between PM10 levels based on population levels through a weighted representation (see appendix 2). It can be concluded that London is not as high as Mexico City and Jakarta but compared to other European Cities, London’s emissions are well above the mean. Furthermore, there appears to be no significant relationship between population levels and PM10 based on visual depiction. A summary of this is available in Table 1.


Implications
To further investigate the relationship between air quality and health through exercise (via smartphone based monitoring) and how this may vary across cities, the number of average steps taken per day across these cities (see figure 4) is compared with levels of air pollution. Data from technology monitoring is expected to be more accurate and reliable than self- reporting measures of activity such as surveys. The analysis assumes that physical mobility also has implications on mental health amongst citizens and further correlated with CPI indications.


Assuming other variables can be controlled for in comparing city contexts, the regression output uses P10 as a dependent variable, run against CPI and average steps for 20 cities on MS Excel as depicted in Figure 5. It implies that the average number of steps does not have a positive relationship with pollution but not a strong one. The coefficient of average steps has a standard error estimated at 0.006 and p-value of 0.1556, which makes it statistically insignificant at a CI level of 95% hence making it confidently applied across the sample size. On the other hand, CPI has a p value of 0.0407 and a coefficient of -1.131. This implies that CPI has a strong negative correlation to air pollution across cities, but that the relationship is statistically significant and cannot be applied confidently across the sample at a 95% CI.

Thus, it cannot be concluded that exercise is impeded by poor air quality significantly, though the analysis would benefit from key considerations such as a larger sample size, the removal of possible correlations amongst variables like CPI and P10 measures and other indicators for exercise. The full dataset is available at: https://drive.google.com/open?id=1i1YfiUf7q7fofClrBMKOxYrslxgJn9Yz.
2. DECISION ANALYSIS
The new UK Law relating to air quality in cities who cross the maximum limit of 200 micrograms per cubic meter over 15 day-based instances in the year is due to be enforced next year with a high likelihood (70%). Based on research from existing research, the following table depicts potential benefits and costs of taking action on existing proposals to counter local pressures in London.
Decision Tree Analysis
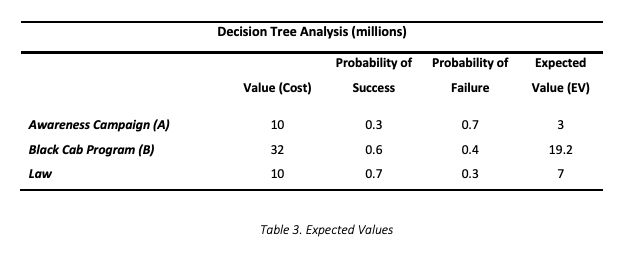
The first proposal is for the mayor to invest GBP 10,000,000 in an awareness campaign (A) aimed at pushing just city workers who travel by car to inner London to switch to public transport. The second focuses on converting Black Cabs (B) to zero-emission engines. Ultimately, both programs have the goal of reducing particulate emission to remain within the clean air threshold.
The decision tree below aims to analyze which option is most advisable for the Mayor of London to invest in. The analysis is informed by the central aim to gain positive press coverage about actions that make London an attractive city with respect to urban air and health quality. In order to ensure investment is assessed with respect to future risks and returns, the fact that London will be faced with a fine of GBP 10 million for every year it exceeds the aforementioned clean air limit, is considered in this analysis.

Based on the above analysis, there are three possible outcomes with associated expected values (determined by the likelihood of events)
i) Success of Proposal: The Black Cab Program costs GBP 32 million and is 60% likely to meet is goal. This gives it an expected value of GBP 19.2 million if successful, and considered alongside the expected value of the law at GBP 7 million considering a 70% probability of being passed, a total of GBP 26.2 million. Alternatively, proposal (A) has an estimated expected value of GBP 3 million when considering the likelihood of success at meeting clean air requirements, which taken with the expected value of the law (GBP 7 million), amounts to GBP 10 million.
ii) Failure of Proposal: On the other hand, if proposal (B) is chosen but fails to meet its aim at a 40% likelihood, its expected value is GBP 12.8 million, amounting to a total of GBP 19.8 million. If proposal (A) does not meet the requirements and the law comes into place, its expected value becomes GBP 7 million when considered with the cost of the law is GBP 14 million.
iii) No Law: If the law is not passed- at a likelihood of 30%- proposal A amounts to a sunk cost of GBP 10 million and proposal B to GBP 32 million.

Thus, as depicted in the decision tree, the mayor would be better off choosing the Awareness Campaign in a situation of high uncertainty in order to manage risks given the identified constraints. Table 4 shows how by multiplying the possible cost in each scenario by its probability and summing the values, the best expected value is one in which costs are minimized for the mayor. In each of the scenarios above, the awareness campaign has the lowest expected value, including in the scenario when no law is passed (resulting in a sunk investment for both proposals).
It must be noted that there is a lack of clarity about what specific information and assumptions have informed these estimates, including the forecasting of probabilities (not objective), and whether the figures have been discounted to include the future rate at which they may vary. Furthermore, the analysis assumes that the clean air threshold is chosen to represent “healthy” air quality, but cities may differ in their view of thresholds. Ergo, the following section will analyze a more detailed cost profile of the policy options, aimed at being more risk-sensitive through incorporating rank-based criteria into analysis.
Monte Carlo Analysis
The cost of the Awareness Campaign has an average value of approximately GBP 15.4 million (significantly higher than suggested earlier), whereas that of the Black Cab Program is GBP 31.6 million (marginally lower than suggested earlier). Considering both are measured using the same values for computer-based optimization (10,000 simulations of projected results) and a selection of expected values considering likelihoods of each event, in order to define the range within which each cost may fall. Since both proposals are characterized by uncertainty, setting the constraints within this optimization occurs is limiting in itself as it brings in a bias that is unavoidable on the part of the consultants who carry out optimization.
Like the decision tree analysis, the simulation is based on assumptions concerning the likelihood of each proposal and assumes both reliability and predictability of human behaviors. The inputs of mean and expected values are essentially defined by research into citizens’ response to particular events. This still means that there is variability in the forecasts as suggested by the results that are outside the minimum and maximum expected values (500 of the 10,000 times they have been run). Furthermore, without knowledge concerning the reliability and rigor of the inputs that have been used by those creating the model, it is difficult to rely on the prediction entirely.
Furthermore, Proposal A’s cost falls within a value of GBP 28.1 million 95% (or 9500) times that it has been simulated. Comparatively, Proposal B’s cost is GBP 57 million for the same exercise and does not achieve the same accuracy in its prediction. This indicates that both the range and the variance in the projections for B are much higher than that of A, hence indicating a greater amount of potential fluctuations, and hence risk, in accurately costing Proposal B. While a higher range may enable a broader scope for simulations, it also suggests that the likelihood of costs is less predictable than that of A. Thus, Proposal A is still the best alternative of both options.
In terms of the simulated forecasts, it is unclear who the users were from whom these responses were recorded. The Awareness Campaign is targeting a different group of user profiles and is likely to be broader than those who commute to work in cars, whereas the black cab fleet is assumedly most relevant to cab drivers or then people who don’t own cars. Hence, it is questionable as to whether the costing forecasts and their effectiveness are actually reliable or have accounted for this difference.
The results of these predictions have also not accounted for possible costs associated with no law being passed and how that may feature into the forecasts or influence the projections, if the proposals have already been implemented. An important element in these predictions is that of time and how costs may change after the first year (or few) of implementation. With no such indication or clarity over how time and discount rates may have been incorporated into the simulation, the results should be treated with caution. Finally, reporting by external consultants may be something of a double edged sword as it brings in perspective that may be absent within government departments but it also should be cross-checked for biases and methodology to ensure that the results are comparable to those employed within the Mayor’s office.
A. MULTI CRITERIA DECISION ANALYSIS (MCDA)
Setting up a public advisory board for decision making should move away from traditional data collection methods like surveys to a model that ensures stakeholder representation to meet its ultimate aim concerning public image and the mitigation of risk. Hence, it is not suggested that this panel of external urban and policy experts should come up with a wide range of alternative proposals, or decide which is most valuable. Instead, their goal should be to drive the analysis of what options are best fitted for London in particular (while being mindful of the city’s contextual constraints, e.g. lack of coordination amongst boroughs). By coming together to ideate on the relevance and feasibility of their ideas, the board should focus on tradeoffs between different proposals with respect to how their respective expertise can measure different criteria thoroughly, and the strengths and weaknesses in policy options.
An MCDA can follow a criterion s representation, where alternative proposals are considered within the context of the problem of ensuring manageable levels of air pollution. The following is a suggested design for MCDA:
Once the different criteria for air pollution management in London are identified, it is likely that different criteria will be satisfied differently by possible solutions (e.g. Proposal A may be more relevant to the problem of unwillingness amongst commuters whereas Proposal B may target congestion. Criteria may range from congestion in Zone 1, limited pedestrian zones, high car ownership in certain neighborhoods, to unwillingness to commute via tube at rush hour.
In order to evaluate tradeoffs amongst possible solutions, criteria can be weighted based on an evaluation of existing constraints within London (e.g. transport laws) as identified by the board. To develop a rank-based criteria hierarchy to identify constraints within the problem’s context, the weighted criteria can be compared to weighted alternatives (based on consensus from the board) and then the most preferred option may be optimized.
However, while this form of a MCDA is certainly more representative and inclusive of different views than Monte Carlo Simulations, it is still restricted to experts in the field and is unlikely to involve input many of London’s citizens who are central to mitigation efforts. Other participatory mechanisms include the following:
• Expert panels or anonymous feedback from experts via the Delphi method. Such experts are likely to involve policy makers, experts in urban quality and air, health, environment, and can provide valuable feedback in an interdisciplinary way like the MCDA.
These participatory forms are still prey to biases that may arise from using weightage to assign values to different criteria and alternatives and hence are not entirely robust in the management of risk when choosing where to invest resources.
Recommendation
Instead, by developing a game in which citizens participate in different forms of air quality monitoring as done in the EveryAware App through portable personal sensors, and are able to view pollution in heat map from across London (EC, 2014). In areas where pollution is at risk of or has exceeded 200 micrograms per cubic meter, citizens can be given alerts with the option to provide feedback on how to counter these reactions. By designing the feedback mechanism in a way that has in-built constraints (e.g. choosing viable categories of solutions like congestion charges), those that are most preferred by citizens can be collected, cross- compared and analyzed.
Additionally, it is recommended to randomly selecting volunteers using the app across London’s boroughs, inexpensive pollution sensors can be given to volunteers to gauge how citizens respond to air pollution levels (EC, 2014). With an in-built choice mechanism to share data from personal sensors into the app in areas where pollution data is missing, users may also input what they feel in areas with and without pollution, and can choose from multiple choices about tackling the problem. This would allow different kinds of stakeholders from within London would respond to the policy objective. Through analyzing the results and clustering different responses, recommendations can be made based on overall behaviors and trends. The aim of a gamified participatory process is to consider public opinion without ignoring scientific expertise, and essentially to use citizen feedback to inform the development of feasible forecasts that have the highest chance of success when implemented to mitigate risks.
B. MANAGING UNCERTAINTY
The above analysis is based on a number of that require more assumptions pertaining to how pollution standards are defined, constraints facing different contexts of decisions based on air quality (such as mitigation efforts) and which variables count as key criteria.
Assumptions and Challenges
Each of these areas is framed by the absence of certainty about London’s future, particularly with respect to new laws that may influence the policy landscape, and levels of risk that may indicate what the tradeoffs in cases of failure. In turn, by their very nature and need for comparison to make meaningful estimations about data, both uncertainties and risks are driven by more assumptions. Hence, a number of critical assumptions with respect to uncertainty are the following:


Recommendation: Pre-existing Scenarios
In order to counter some of these uncertainties and the challenges they present, it may be useful to build scenarios that can identify critical uncertainties rather than make value-laden predictions of what might occur. This is likely to counter the challenge of dynamic events, and amplify tradeoffs. Ultimately, constructing different scenarios will allow mitigation efforts to be sensitive to a worst-case scenarios and robust enough to face different possible futures under different assumptions to meet the mayor’s objective.
Drawing partly from this, partly from interdisciplinary expert inputs (as directed by the board), and citizens of London, critical uncertainties based on the earlier analysis can be compared to those that arise through a scenario development. Additionally, London has the benefit of a network of attractive cities, where many of them are dealing with worse and better air quality and health. Since data is readily available on the kinds of innovation-based and worst-case scenarios that cities are currently facing, pre-constructed scenarios can follow from 4 cases (with one being business as usual). For example, one scenario in recorded history was when London was faced with the Great Smog of 1952 (The Guardian, 2012). By reviewing these scenarios, a few key words can be selected across scenarios (approximately 3 to 5 for thorough analysis) and then summarized in a matrix form to find what commonalities exist and then assess how these key words are relevant to the design of future mitigation policies.